Exploratory data analysis is the process of examining, summarising, and visualising a dataset to understand its structure, identify patterns, detect anomalies, and discover relationships between variables before performing advanced analysis or modelling.
EDA helps data analysts and data scientists ask better questions, identify potential problems in a dataset, and determine which statistical or machine learning techniques may be appropriate.
In this guide, you'll learn what exploratory data analysis is, why EDA is important, the types of EDA, common EDA tools, and the step-by-step process of performing EDA.
What Is Exploratory Data Analysis?
Exploratory data analysis (EDA) is an iterative approach to investigating a dataset using statistical techniques, data summaries, and visualisations to understand its main characteristics.
Unlike analysis that begins with a fixed hypothesis, EDA allows you to explore the data with an open mind. You can discover unexpected patterns, unusual observations, relationships between variables, and potential data-quality issues before deciding what to investigate further.
The concept of EDA was introduced by American statistician John Tukey in the 1970s. The approach continues to be widely used in modern data analytics, data science, and machine learning.
For example, imagine you have customer data containing:
Age
Location
Income
Purchase frequency
Product category
Customer lifetime value
Before creating a customer segmentation model, EDA can help you discover whether certain age groups purchase more frequently, whether income is related to spending, whether some values are missing, or whether a few customers have unusually high purchase amounts.
In simple terms, EDA helps you understand your data before asking the data to make predictions.
Why Is Exploratory Data Analysis Important?
EDA is an important part of the data analysis process because poor-quality or misunderstood data can lead to unreliable conclusions.
Here are some of the main benefits of exploratory data analysis:
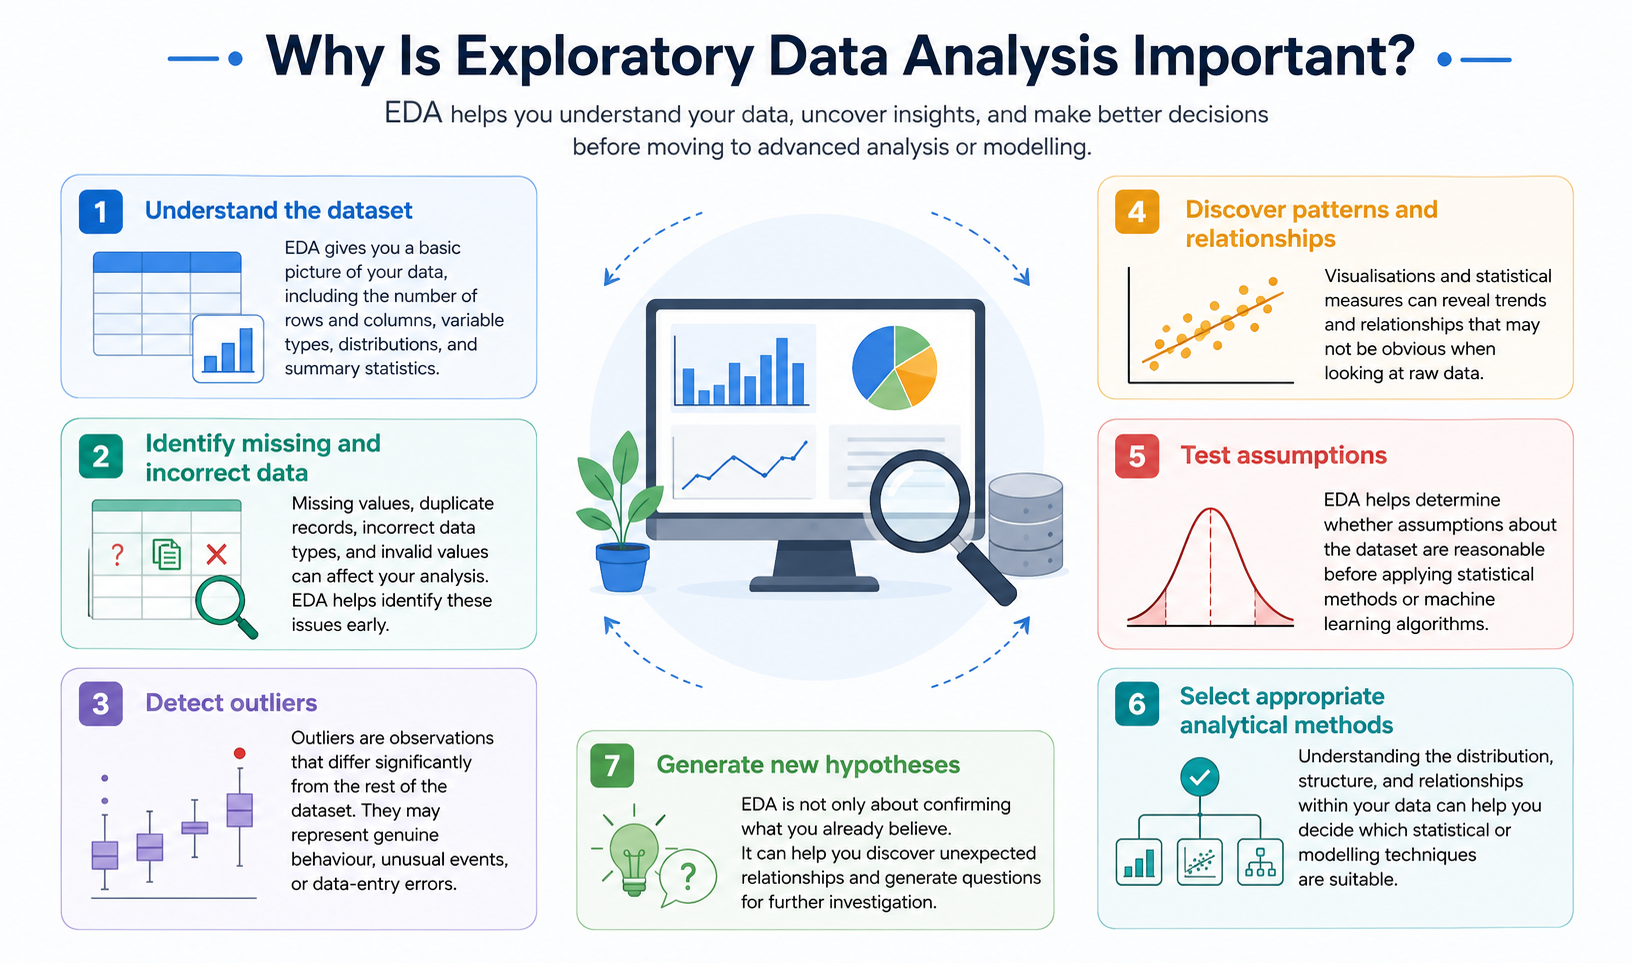
1. Understand the dataset
EDA gives you a basic picture of your data, including the number of rows and columns, variable types, distributions, and summary statistics.
2. Identify missing and incorrect data
Missing values, duplicate records, incorrect data types, and invalid values can affect your analysis. EDA helps identify these issues early.
3. Detect outliers
Outliers are observations that differ significantly from the rest of the dataset. They may represent genuine behaviour, unusual events, or data-entry errors.
4. Discover patterns and relationships
Visualisations and statistical measures can reveal trends and relationships that may not be obvious when looking at raw data.
5. Test assumptions
EDA helps determine whether assumptions about the dataset are reasonable before applying statistical methods or machine learning algorithms.
6. Select appropriate analytical methods
Understanding the distribution, structure, and relationships within your data can help you decide which statistical or modelling techniques are suitable.
7. Generate new hypotheses
EDA is not only about confirming what you already believe. It can help you discover unexpected relationships and generate questions for further investigation.
What Are the Types of Exploratory Data Analysis?
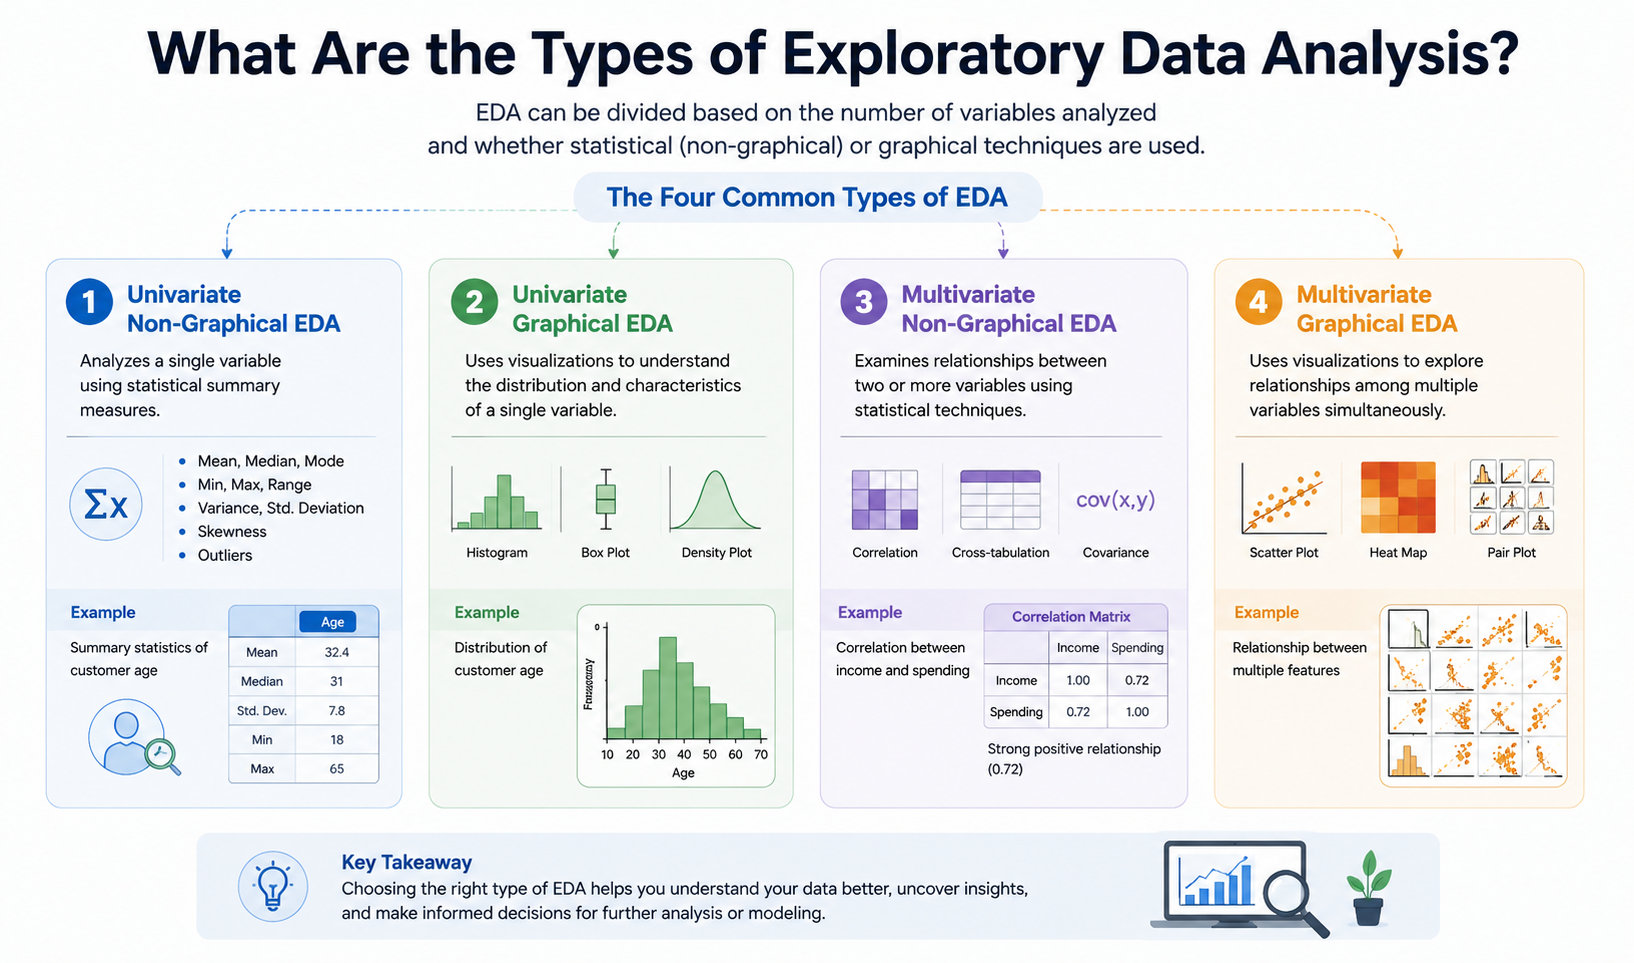
EDA can generally be divided according to the number of variables being studied and whether statistical or graphical techniques are used.
The four common types of EDA are:
Univariate non-graphical EDA
Univariate graphical EDA
Multivariate non-graphical EDA
Multivariate graphical EDA
1. Univariate Non-Graphical EDA
Univariate analysis focuses on a single variable at a time. The objective is to understand the variable's central tendency, spread, and distribution using statistical measures.
Common measures include:
Mean
Median
Mode
Minimum and maximum
Range
Variance
Standard deviation
Skewness
Number of outliers
For example, if you're analysing customer age, calculating the mean and median age can give you an initial understanding of the dataset.
2. Univariate Graphical EDA
Univariate graphical analysis uses visualisations to understand one variable.
Common visualisation techniques include:
Histograms
Box plots
Density plots
Stem-and-leaf plots
Quantile-normal plots
A histogram can show how numerical values are distributed, while a box plot can make potential outliers easier to identify.
3. Multivariate Non-Graphical EDA
Multivariate analysis examines relationships between multiple variables.
Common techniques include:
Correlation
Covariance
Cross-tabulation
Summary statistics
For example, you could examine whether customer income and spending show a relationship.
Correlation can indicate the strength and direction of a relationship, while covariance shows how variables change in relation to each other.
4. Multivariate Graphical EDA
Multivariate graphical analysis uses visualisations to understand relationships among multiple variables.
Common examples include:
Scatter plots
Heat maps
Bubble charts
Grouped bar charts
Pair plots
Multivariate charts
For instance, a scatter plot could help you visualise the relationship between advertising spend and sales.
How to Perform Exploratory Data Analysis?
Now that you understand what EDA means, let's look at how to perform exploratory data analysis step by step.
The exact workflow can vary depending on the dataset and the objective, but a typical EDA process includes the following steps.
Step 1: Understand the Problem and Dataset
Before opening Python, Excel, R, or another analytics tool, understand the question you are trying to answer.
Ask:
What problem are we trying to solve?
What does the dataset represent?
What does each variable mean?
Which variables are numerical or categorical?
What are the limitations of the data?
What outcome or business question are we interested in?
This step prevents you from analysing data without understanding its context.
Step 2: Import and Inspect the Data
Load your dataset into an appropriate tool and perform an initial inspection.
For example, in Python, the Pandas library can be used to load and inspect data.
import pandas as pd
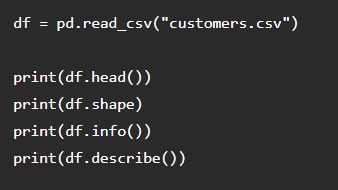
These basic commands can help you understand the dataset's size, structure, data types, and numerical characteristics.
At this stage, also check for:
Missing values
Duplicate records
Incorrect data types
Invalid values
Unexpected categories
Unusual observations
Step 3: Handle Missing Data
Missing data is common in real-world datasets.
However, you shouldn't automatically delete every row containing a missing value. First, investigate why the data is missing and determine how removing or replacing it could affect the analysis.
Depending on the situation, you may:
Remove records
Replace missing values with the mean
Use the median
Use the mode for categorical variables
Apply regression-based imputation
Use techniques such as KNN imputation
The right approach depends on the dataset and the reason the information is missing.
Step 4: Analyse Data Characteristics
Next, examine the statistical characteristics of your variables.
For numerical variables, look at:
Mean
Median
Standard deviation
Minimum
Maximum
Quartiles
Skewness
Distribution
For categorical variables, examine:
Number of unique categories
Frequency of each category
Most common values
Rare categories
This gives you a clearer picture of what your dataset actually looks like.
Step 5: Visualise the Data
Data visualisation is one of the most important parts of EDA because patterns that are difficult to identify in tables can become obvious in a chart.
Some commonly used visualisations include:
Data Question | Useful Visualisation |
How are numerical values distributed? | Histogram |
Are there outliers? | Box plot |
How do categories compare? | Bar chart |
Are two numerical variables related? | Scatter plot |
How do values change over time? | Line chart |
How are several variables correlated? | Heat map |
How do multiple variables interact? | Pair plot |
For example, a scatter plot could reveal whether sales tend to increase as advertising expenditure increases.
Step 6: Examine Relationships Between Variables
Once you understand individual variables, explore how they interact.
For numerical variables, correlation analysis and scatter plots can be useful.
For categorical variables, cross-tabulation and grouped charts can help identify differences between groups.
For example, you might investigate:
Income vs spending
Age vs purchase frequency
Advertising spend vs sales
Product category vs revenue
Location vs customer retention
However, remember that correlation does not automatically mean causation. A relationship between two variables does not necessarily prove that one variable causes changes in the other.
Step 7: Identify and Evaluate Outliers
Outliers can significantly affect statistical analysis and machine learning models.
Common methods for identifying outliers include:
Interquartile Range (IQR)
Z-score
Box plots
Distribution analysis
But don't immediately remove an outlier just because it looks unusual.
An unusual value could be:
A data-entry error
A measurement error
A genuine extreme observation
An important business event
For example, an unusually high purchase amount could be an error—or it could represent a valuable customer.
Use context and domain knowledge before deciding what to do with outliers.
Step 8: Transform the Data When Necessary
After exploring the dataset, you may need to transform some variables.
Common transformations include:
Scaling numerical variables
Standardisation
Min-max normalisation
One-hot encoding
Label encoding
Log transformations
Creating new features
Grouping or aggregating data
For example, a date column could be transformed into separate features such as month, quarter, weekday, or year.
These transformations can make the dataset more suitable for further analysis or machine learning.
Step 9: Communicate the Findings
EDA is not complete when you create a collection of charts.
The final step is to communicate what the data is telling you.
A good EDA report should clearly explain:
What was investigated
What patterns were discovered
Which variables appear important
What anomalies were identified
What limitations exist
What should be investigated next
Use charts and concise explanations to make your findings understandable to both technical and non-technical stakeholders.
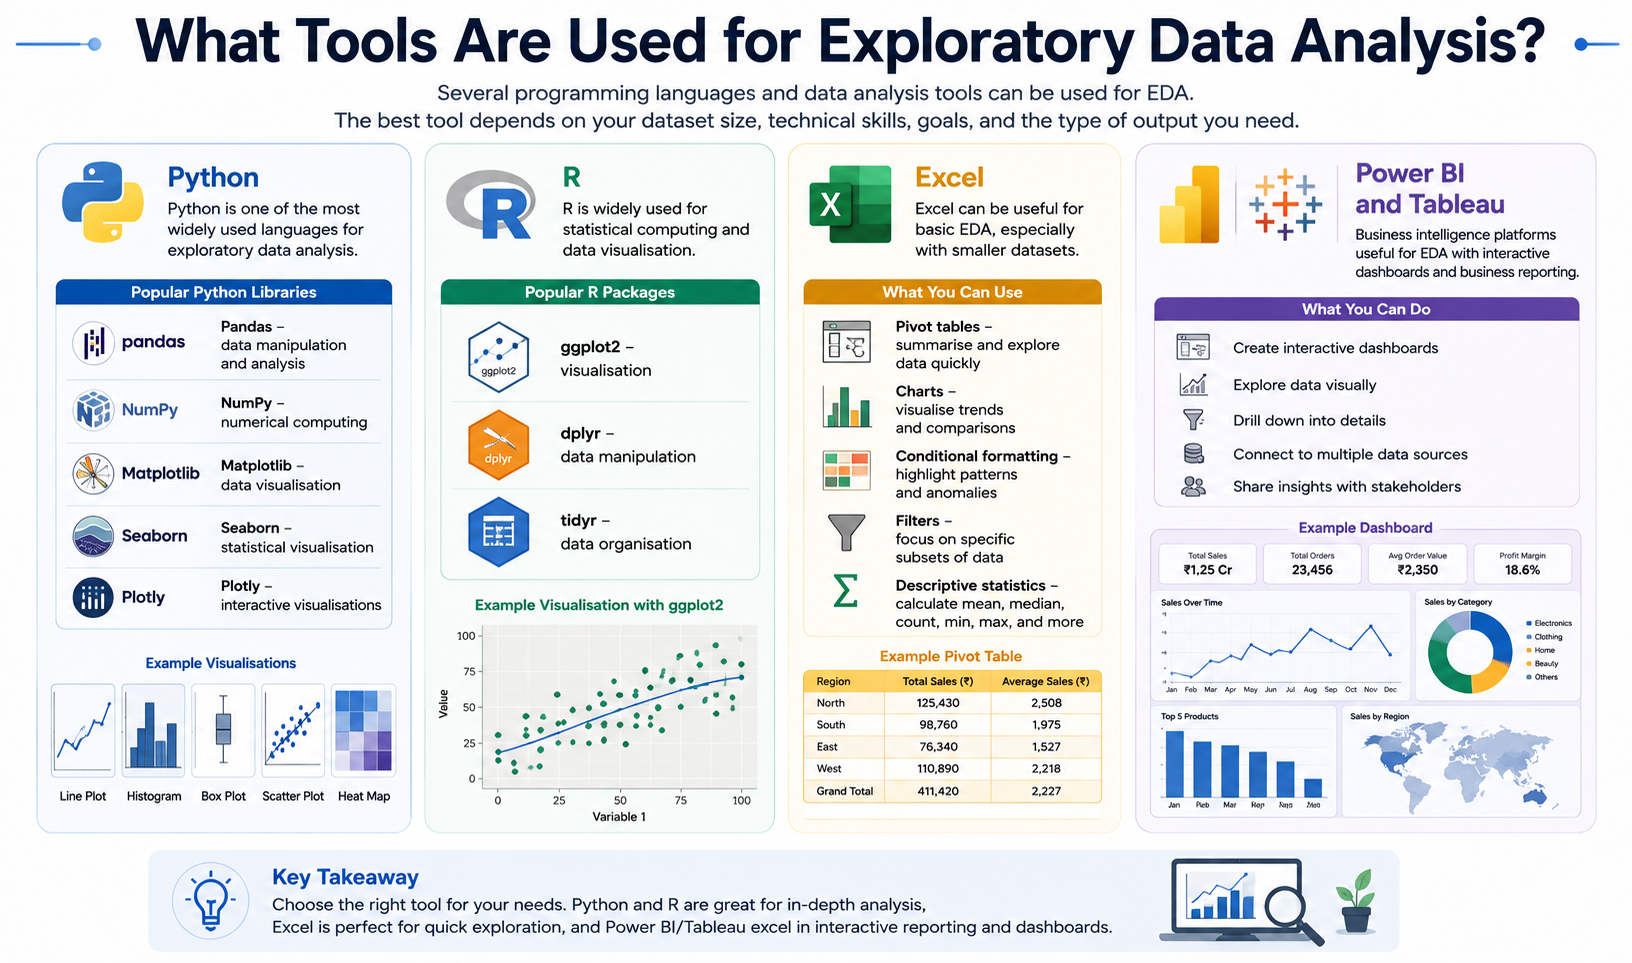
What Tools Are Used for Exploratory Data Analysis?
Several programming languages and data analysis tools can be used for EDA.
Python
Python is one of the most widely used languages for exploratory data analysis.
Popular Python libraries include:
Pandas – data manipulation and analysis
NumPy – numerical computing
Matplotlib – data visualisation
Seaborn – statistical visualisation
Plotly – interactive visualisations
R
R is widely used for statistical computing and data visualisation.
Popular R packages include:
ggplot2 – visualisation
dplyr – data manipulation
tidyr – data organisation
Excel
Excel can also be useful for basic EDA, particularly when working with smaller datasets.
You can use:
Pivot tables
Charts
Conditional formatting
Filters
Descriptive statistics
Power BI and Tableau
Business intelligence platforms such as Power BI and Tableau are useful when EDA involves interactive dashboards and business reporting.
The best tool depends on the size of your dataset, technical requirements, analysis goals, and the type of output you need.
EDA vs Data Analysis: What's the Difference?
EDA is a part of the broader data analysis process.
The main difference is that EDA focuses heavily on discovering what the data contains before making firm conclusions or building advanced models.
Think of it this way:
EDA asks:
"What can we discover from this data?"
Further statistical or confirmatory analysis asks:
"Does this specific hypothesis or relationship hold under formal testing?"
EDA is therefore often an early, iterative stage that helps guide subsequent analysis.
What Are the Real-World Applications of EDA?
Exploratory data analysis is used across many industries.
Marketing
Businesses can analyse customer behaviour, campaign performance, conversion rates, and segmentation patterns.
Finance
EDA can help identify unusual transactions, trends, risk patterns, and relationships between financial variables.
Healthcare
Researchers and healthcare organisations can explore patient records, health measurements, and trends before conducting further statistical or predictive analysis.
Manufacturing
EDA can help identify production anomalies, quality issues, and relationships between manufacturing variables.
E-commerce
Businesses can investigate customer purchasing behaviour, product performance, revenue patterns, and customer segments.
Education
Educational organisations can analyse achievement scores, demographic information, programme performance, and other metrics to identify patterns and areas for improvement.
What Is the Role of EDA in Data Science?
EDA plays a critical role in data science because data scientists need to understand the structure and quality of data before developing predictive models.
A typical workflow might look like:

EDA can help identify important variables, unusual observations, relationships, and data-quality problems before they affect a machine learning model.
For someone learning data science, therefore, understanding EDA is not simply about creating charts. It involves learning how to ask questions, investigate data, interpret patterns, and communicate insights.
Final Thoughts
Exploratory data analysis is the process of understanding your data before using it to make conclusions or build models. It combines statistical techniques, visualisation, and critical thinking to uncover patterns, identify anomalies, understand relationships, and assess data quality.
A strong EDA process typically follows this path:

If you want to take your data analytics skills beyond basic EDA and learn how AI, data analysis, visualisation, and real-world tools work together, consider exploring HACA’s AI-Integrated Data Analytics Course in Kerala. It can help you build practical data analytics skills while understanding how AI can be applied to modern data-driven workflows.
Once you can confidently explore a dataset and turn raw information into meaningful insights, you're building one of the core skills needed for modern data-driven careers.