
"Every Product Has a Story. Rushda Used Data to Discover It."
Why do some products attract more customer attention than others? Which categories receive better ratings? And what can product prices and discounts reveal about the marketplace?
These were some of the questions explored by Fathima Rushda through her Amazon Product Analytics Dashboard as part of her learning journey at HACA Tech School.
As an online student from the DAO6 batch, Rushda was introduced to practical applications of data analysis through her Data Analytics course at HACA Tech School. Her e-commerce analytics project focused on understanding product performance, customer preferences and pricing trends.
Working with product information such as ratings, reviews, prices and discounts, she developed an interactive dashboard that transformed a large collection of raw data into meaningful visual insights.
Her project demonstrated how data analytics can help turn everyday business information into a clearer picture of market behaviour.
Understanding the Business Challenge
E-commerce businesses deal with different types of product information every day. While this data contains valuable insights, finding useful patterns across multiple categories can be difficult.
Rushda approached this challenge by identifying the questions her dashboard needed to answer.
Her analysis focused on understanding:
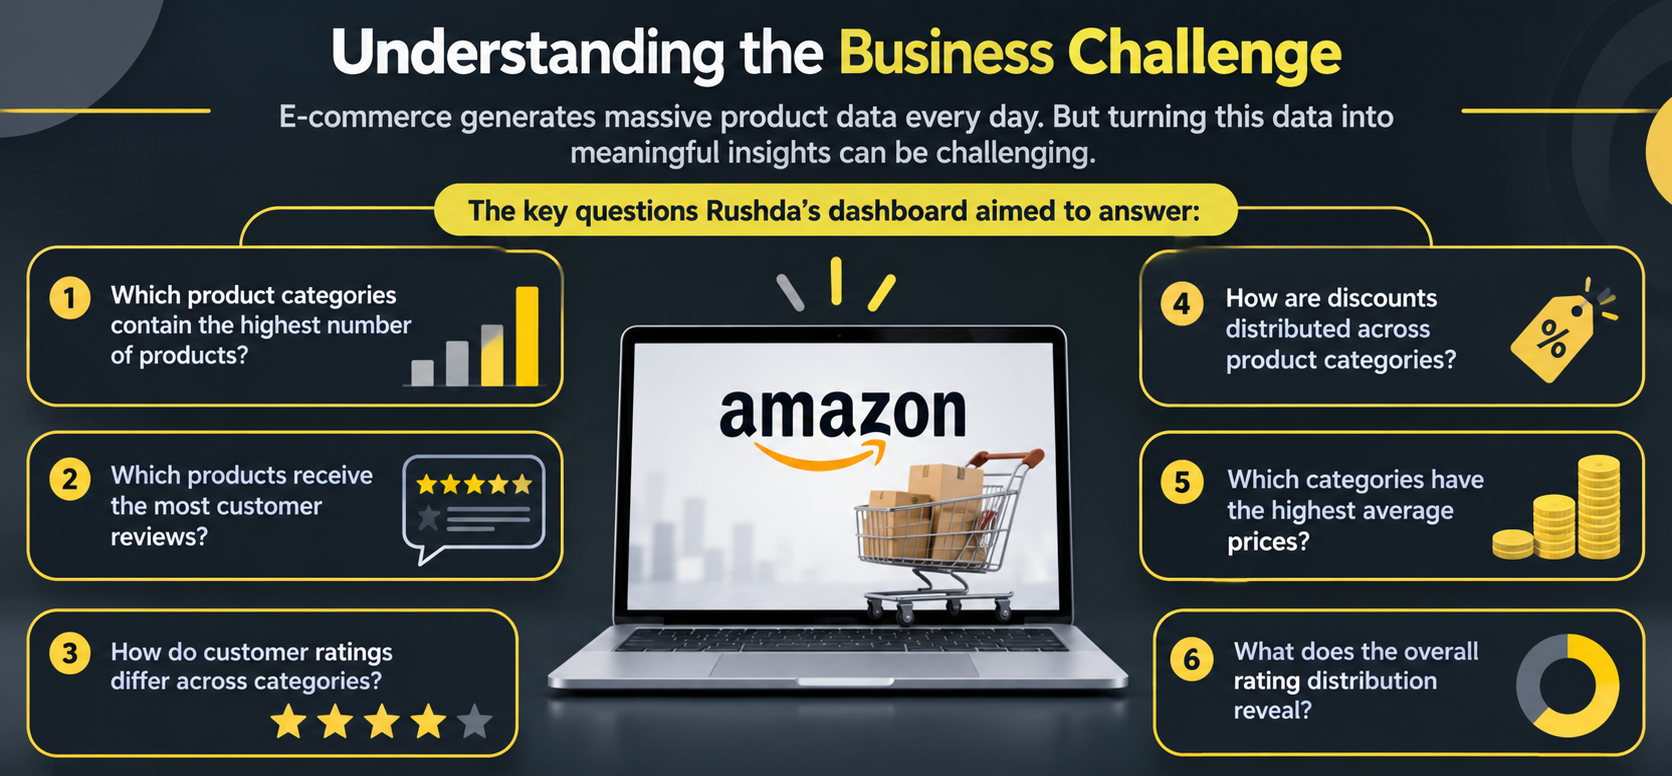
Which product categories contain the highest number of products?
Which products receive the most customer reviews?
How do customer ratings differ across categories?
How are discounts distributed across product categories?
Which categories have the highest average prices?
What does the overall rating distribution reveal?
These questions gave her project a clear purpose: make product data easier to explore, compare and understand.
Building an Interactive Analytics Dashboard
Rather than presenting information through static reports, Fathima developed an interactive dashboard with multiple visualisations and key performance indicators (KPIs).
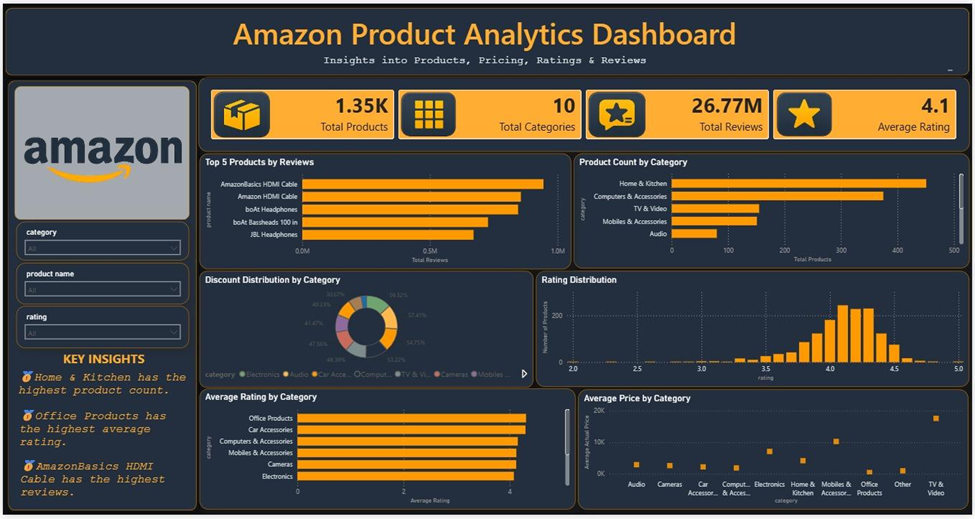
The dashboard brought together six major areas of analysis.
1. Product Popularity Analysis
Fathima analysed the top five products based on customer review counts. This helped identify products that attracted significant customer engagement and attention.
2. Category-Wise Product Distribution
The dashboard compared product availability across different categories, making it easier to identify dominant product segments.
3. Discount Distribution Analysis
By examining discount patterns across categories, the project highlighted differences in promotional pricing and discount strategies.
4. Customer Rating Analysis
The rating distribution helped understand overall customer satisfaction and identify how customers evaluated products.
5. Average Rating by Category
This analysis compared average customer ratings across product categories to identify segments with stronger customer satisfaction.
6. Average Price by Category
Fathima also examined average product prices across categories, helping reveal differences in pricing patterns and product positioning.
Exploring the Dashboard Highlights
To provide a quick overview of the Amazon product dataset and make the findings easier to understand, Rushda included four key performance indicators (KPIs) that summarised the dataset.
Key Dashboard Metrics:
KPI | Dashboard Value |
Total Products | 1.35K |
Total Categories | 10 |
Total Reviews | 26.77M |
Average Rating | 4.1/5 |
The dashboard also included interactive filters for product category, product name and rating.
These features allowed users to explore specific products and categories, making the dashboard more flexible and useful for focused analysis.
What the Data Revealed
One of the most important parts of the project was discovering what the data actually revealed.
Through her analysis, Fathima identified several interesting patterns:
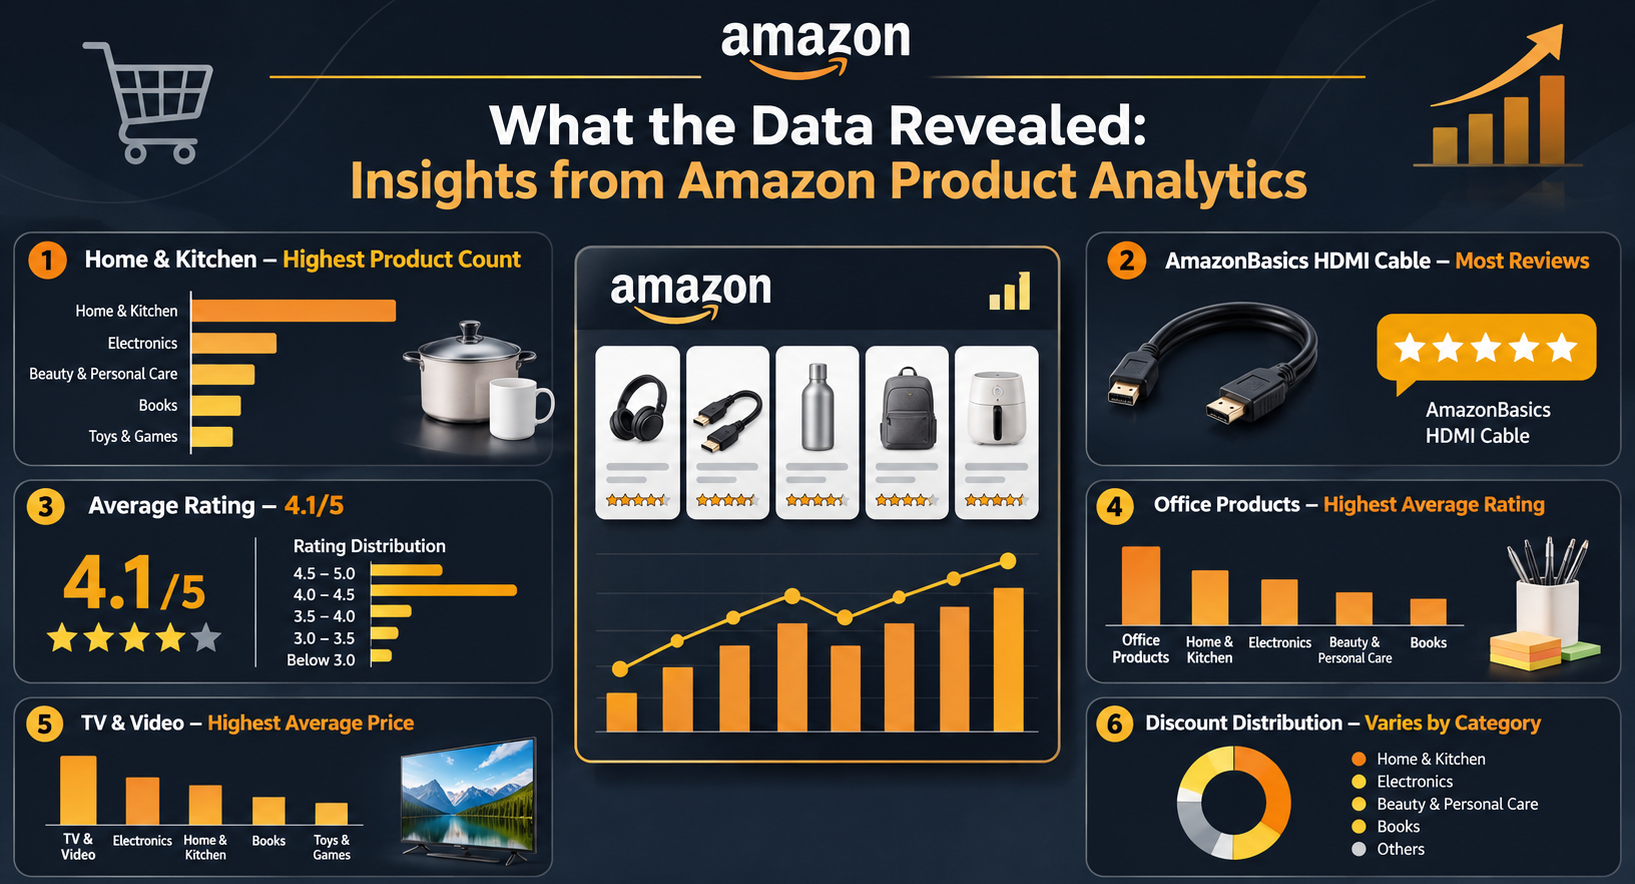
Home & Kitchen Dominates Product Listings
Home & Kitchen recorded the highest number of products among the analysed categories.
AmazonBasics HDMI Cable Leads in Reviews
Among the top five products, AmazonBasics HDMI Cable received the highest number of customer reviews.
Overall Ratings Reflect Positive Customer Feedback
The dataset recorded an average product rating of 4.1 out of 5. A large concentration of products received ratings between 4.0 and 4.5.
Office Products Takes the Lead in Average Ratings
Office Products recorded the highest average customer rating among the displayed categories.
TV & Video Records Higher Average Prices
The analysis identified TV & Video as the category with the highest average product price among the displayed categories.
Discount Patterns Vary Across Categories
The dashboard revealed differences in discount distribution, highlighting how promotional pricing patterns can vary between product segments.
These findings showed how different data points could come together to provide a better understanding of e-commerce product performance.
Putting Data Analytics Skills into Practice
Throughout the project, Fathima applied several important data analytics concepts, including:
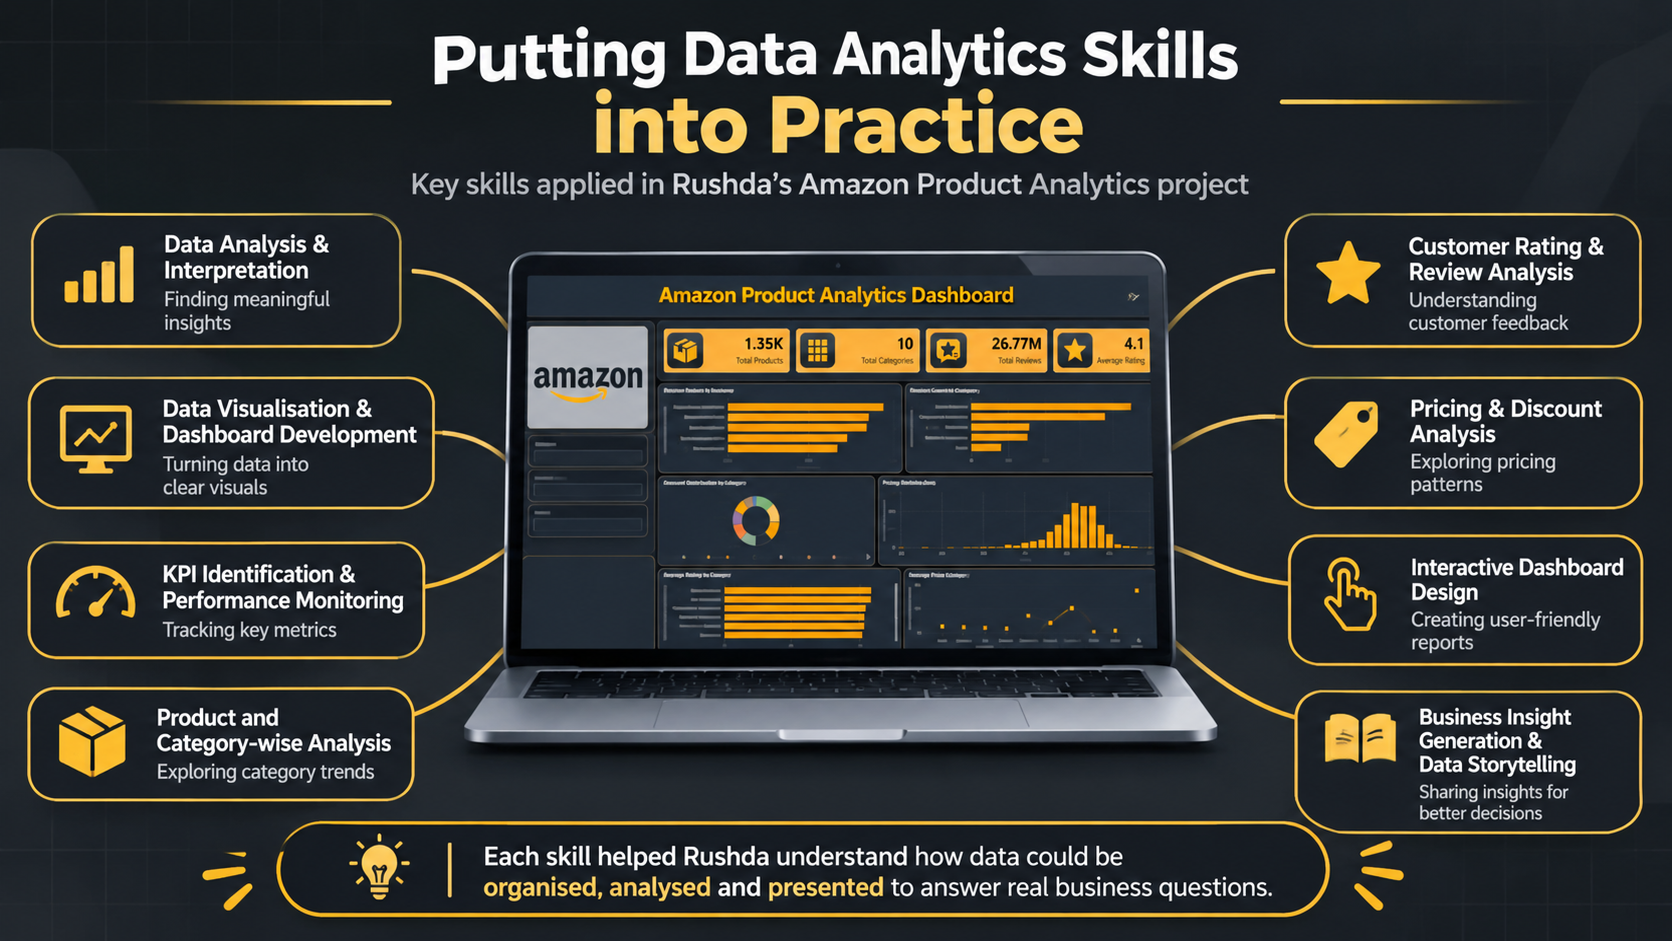
Data analysis and interpretation
Data visualisation and dashboard development
KPI identification and performance monitoring
Product and category-wise analysis
Customer rating and review analysis
Pricing and discount analysis
Interactive dashboard design
Business insight generation and data storytelling
Each component helped her understand how data could be organised, analysed and presented to answer practical business questions.
A Practical Step Towards Becoming a Data Analyst
Rushda's Amazon Product Analytics Dashboard demonstrates how raw e-commerce information can become a useful business intelligence resource.
By combining performance indicators, interactive filters and multiple visualisations, she created a consolidated view of product popularity, customer satisfaction, category performance and pricing trends.
The project reflects her ability to apply data analytics concepts to a practical business scenario and communicate findings through an interactive dashboard.
It also reflects the importance of asking the right questions before analysing data and choosing the right visualisations to communicate findings.
For Rushda, the project represents an opportunity to apply data analytics concepts to a practical business scenario and explore how information can support better decision-making.
Because great data analysis isn't just about knowing what the numbers say. It's about understanding what they mean.