Every business collects data, but collecting data is only the beginning. Sales numbers, customer behaviour, website traffic, marketing performance, and other business activities generate valuable information every day. The real challenge is understanding what that information means and using it to make better decisions.
This is where data analytics becomes important.
Data analytics is the process of collecting, cleaning, examining, and interpreting data to identify patterns, answer questions, and support better decisions. It helps businesses examine data, identify patterns, understand problems, measure performance, and make informed decisions. It can help answer simple but important questions: What happened? Why did it happen? What could happen next? And what should the business do about it?
In this guide, you'll learn what data analytics is, how the data analytics process works, the four types of data analytics, its benefits and business applications, the role of a data analyst, the tools and skills involved, and how to start learning data analytics.
What Is Data Analytics?
Data analytics is the process of examining raw data to find useful patterns, trends, relationships, and insights that can support decision-making.
In simple terms, data analytics helps answer questions such as:
What happened?
Why did it happen?
What is likely to happen next?
What should we do about it?
For example, imagine an online clothing store notices that sales have decreased by 15% over the last three months.
Instead of simply assuming that customers are losing interest, the business can analyse its data.
It might discover that:
Mobile purchases have dropped significantly.
Customers are abandoning their carts more frequently.
One product category has experienced a major decline.
Customers from a particular location are buying less.
A competitor recently launched aggressive discounts.
These insights give the company something much more valuable than a spreadsheet: a basis for making a decision.
How Does Data Analytics Work?
Data analytics usually follows a series of steps that transform raw information into useful insights.
The exact process can vary depending on the organisation and project, but it commonly looks like this:
Data collection → Data cleaning → Data analysis → Data interpretation → Decision-making

Let's break it down.
1. Data Collection
The first step is gathering relevant data.
Businesses can collect data from sources such as:
Websites
Mobile applications
CRM systems
Sales platforms
Customer surveys
Social media
Advertising platforms
Financial systems
IoT devices
The quality and relevance of the collected data directly affect the quality of the analysis.
2. Data Cleaning
Raw data is rarely perfect.
It may contain:
Duplicate records
Missing values
Incorrect entries
Formatting problems
Outliers
Inconsistent information
Data analysts clean and organise the dataset before analysing it.
This step is important because poor-quality data can produce misleading conclusions.
3. Data Analysis
Once the data is cleaned, analysts examine it to identify patterns, trends, relationships, and unusual findings. This stage helps them understand what the data is showing and answer the business question they started with.
One important part of this process is exploratory data analysis (EDA). It helps analysts understand the structure of a dataset, identify patterns, detect outliers, and uncover relationships before moving into deeper analysis. You can learn more about this process in our guide to exploratory data analysis.
Depending on the type of data and the question they need to answer, analysts may use:
Statistical analysis
Data visualisation
Trend analysis
Correlation analysis
Segmentation
Predictive models
4. Data Interpretation
Finding a pattern isn't enough.
An analyst needs to understand what the pattern actually means.
For example, website traffic may have increased by 30%, but if sales remained unchanged, the business needs to investigate why.
This is where analytical thinking becomes important.
5. Decision-Making
The final goal is to turn insights into action.
A business might use the findings to:
Change its pricing
Improve a product
Target a different customer segment
Reduce unnecessary expenses
Change its marketing strategy
Improve customer service
This is what makes data analytics valuable to organisations.
What Are the Four Types of Data Analytics?
Data analytics is commonly divided into four major types:
Type | Main Question | Example |
Descriptive analytics | What happened? | Sales increased by 20% last quarter |
Diagnostic analytics | Why did it happen? | Sales increased because of a successful campaign |
Predictive analytics | What might happen next? | Sales may increase during the upcoming festive season |
Prescriptive analytics | What should we do? | Increase inventory before the expected demand spike |
Let's look at each one.
1. Descriptive Analytics
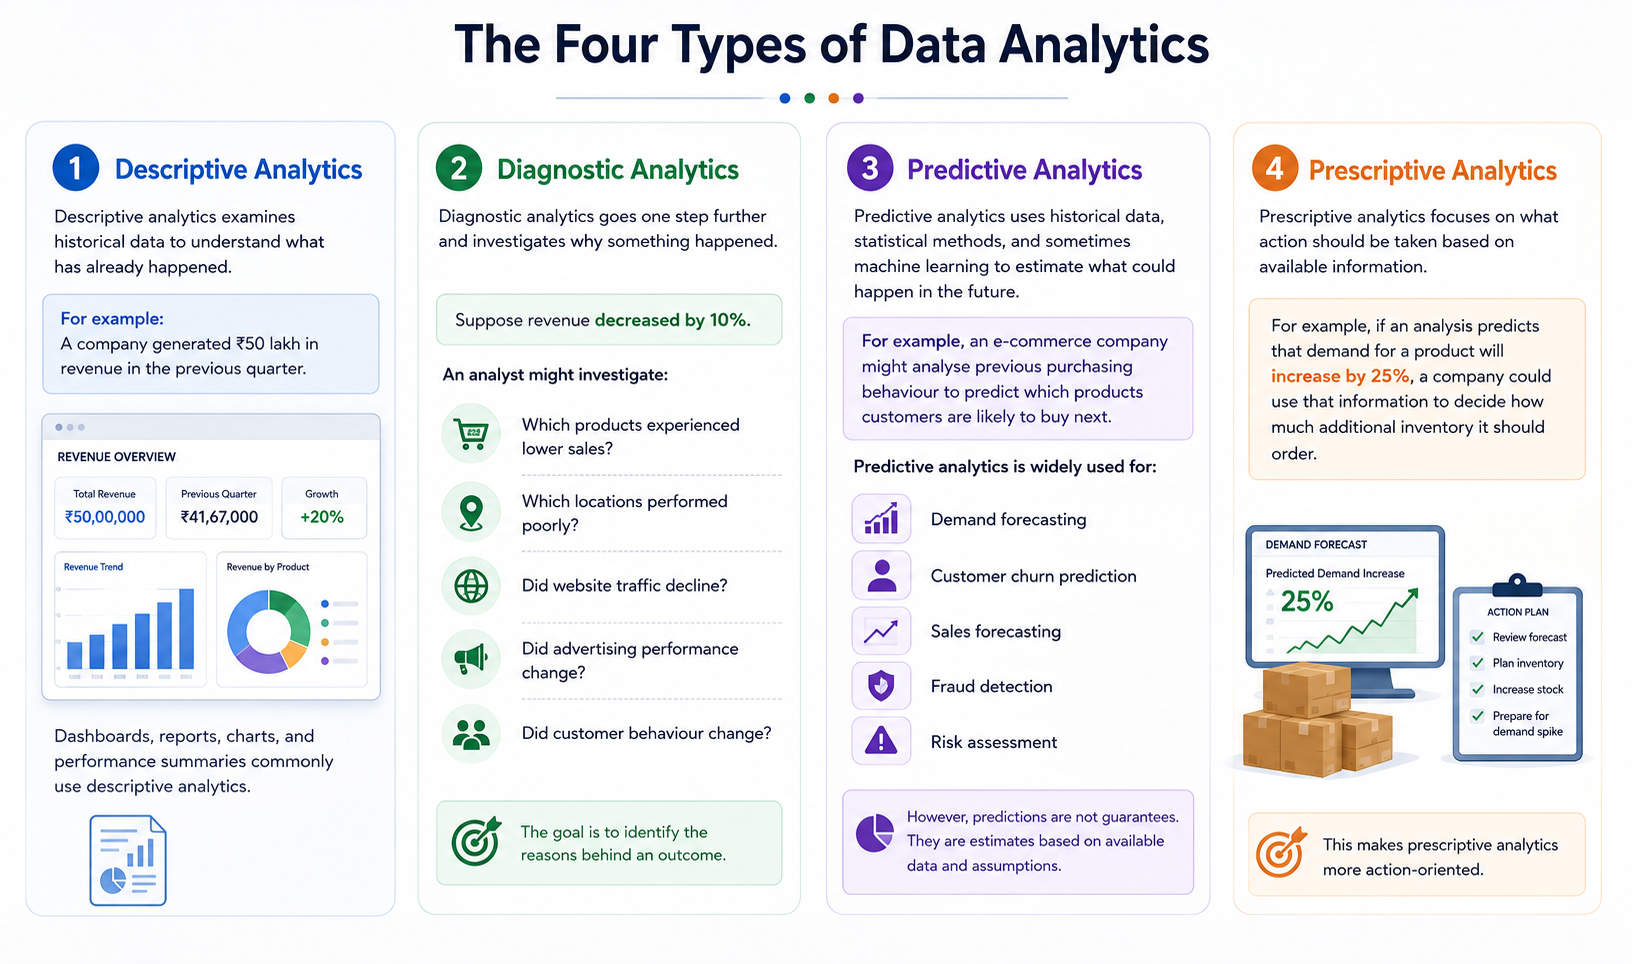
Descriptive analytics examines historical data to understand what has already happened.
For example:
A company generated ₹50 lakh in revenue in the previous quarter.
Dashboards, reports, charts, and performance summaries commonly use descriptive analytics.
2. Diagnostic Analytics
Diagnostic analytics goes one step further and investigates why something happened.
Suppose revenue decreased by 10%.
An analyst might investigate:
Which products experienced lower sales?
Which locations performed poorly?
Did website traffic decline?
Did advertising performance change?
Did customer behaviour change?
The goal is to identify the reasons behind an outcome.
3. Predictive Analytics
Predictive analytics uses historical data, statistical methods, and sometimes machine learning to estimate what could happen in the future.
For example, an e-commerce company might analyse previous purchasing behaviour to predict which products customers are likely to buy next.
Predictive analytics is widely used for:
Demand forecasting
Customer churn prediction
Sales forecasting
Fraud detection
Risk assessment
However, predictions are not guarantees. They are estimates based on available data and assumptions.
4. Prescriptive Analytics
Prescriptive analytics focuses on what action should be taken based on available information.
For example, if an analysis predicts that demand for a product will increase by 25%, a company could use that information to decide how much additional inventory it should order.
This makes prescriptive analytics more action-oriented.
Why Is Data Analytics Important for Businesses?
Data analytics can help businesses make decisions based on evidence instead of relying entirely on assumptions or intuition.

Here are some of its biggest benefits.
1. Better Decision-Making
Instead of asking, "What do we think customers want?", businesses can examine customer behaviour and make decisions based on evidence.
2. Understanding Customers
Businesses can analyse:
Purchasing behaviour
Demographics
Website activity
Customer feedback
Product preferences
This helps companies understand who their customers are and what they need.
3. Improving Marketing Performance
Marketing teams can analyse campaign data to determine:
Which channels generate leads
Which campaigns generate sales
Which audiences convert better
How much customer acquisition costs
This allows businesses to allocate their marketing budgets more effectively.
4. Reducing Costs
Data can reveal inefficient processes and unnecessary expenses.
For example, a company might discover that a particular operational process takes twice as long as another similar process.
That insight can lead to process improvements and cost savings.
5. Identifying Business Opportunities
Data can reveal emerging trends that might otherwise go unnoticed.
A company could discover that demand for a particular product is growing among a specific customer segment and create a new offering around it.
6. Managing Risk
Banks, insurance companies, e-commerce businesses, and other organisations use data analytics to identify unusual patterns and potential risks.
For example, unusual transaction behaviour can help organisations identify potentially fraudulent activity.
How Do Businesses Use Data Analytics?
Data analytics is not limited to technology companies. Almost every industry can use it.
Industry | Common Use of Data Analytics |
Retail | Customer behaviour, inventory and sales forecasting |
Healthcare | Patient data and operational analysis |
Banking | Fraud detection and risk assessment |
Marketing | Campaign performance and customer segmentation |
Manufacturing | Production and quality analysis |
E-commerce | Recommendations and customer behaviour |
Education | Student performance and engagement |
Logistics | Route and delivery optimisation |
Human Resources | Recruitment and workforce analysis |
The specific data and tools may change, but the underlying idea remains the same: use data to understand a problem and make better decisions.
Is Data Analytics a Good Career?
Data analytics can be a strong career option for people who enjoy working with numbers, solving problems, finding patterns, and turning information into practical conclusions.
The field also applies across multiple industries, which gives analysts opportunities beyond traditional technology companies. If you're considering data analytics as a career, our detailed guide on whether data analytics is a good career explores the career scope, opportunities, skills, and factors to consider before entering the field.
However, getting into data analytics requires more than completing a course or learning a few software tools.
You need to demonstrate that you can:
Understand business problems
Work with real datasets
Clean and analyse data
Build useful reports
Explain insights
Make logical recommendations
Practical projects are therefore an important part of building a data analytics portfolio.
What Does a Data Analyst Do?
A data analyst is responsible for working with data to answer business or organisational questions.
Their work can include:
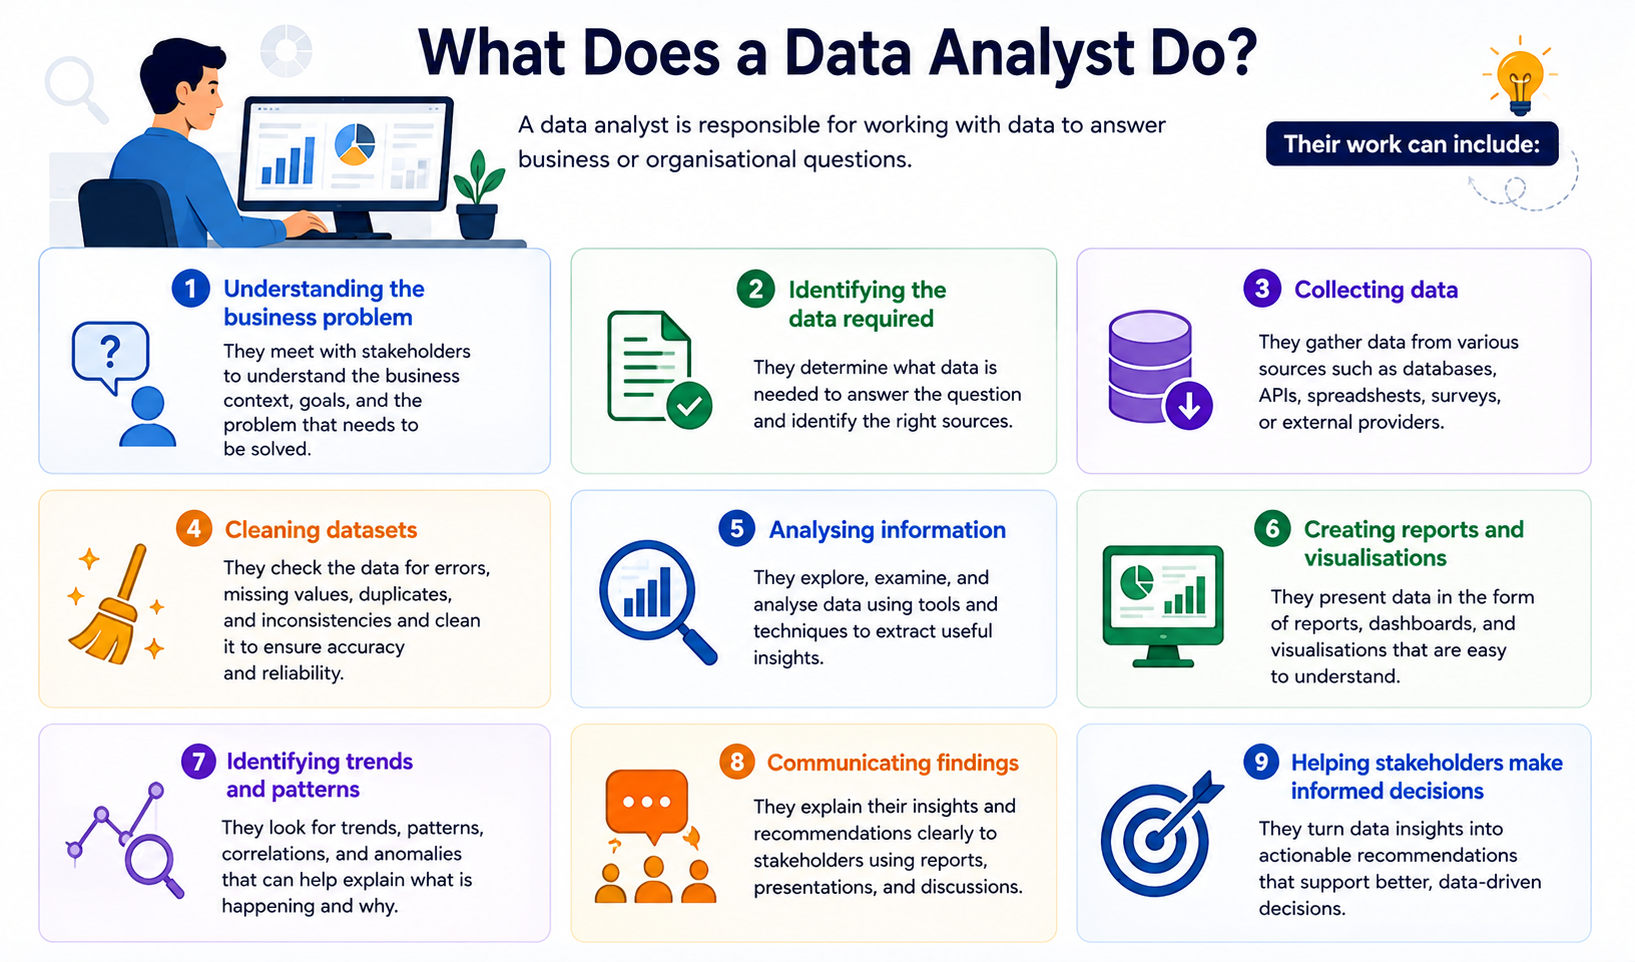
Understanding the business problem
Identifying the data required
Collecting data
Cleaning datasets
Analysing information
Creating reports and visualisations
Identifying trends and patterns
Communicating findings
Helping stakeholders make informed decisions
A common misconception is that data analysts simply work with numbers.
In reality, problem-solving and communication are just as important as technical skills.
An analyst might have excellent technical knowledge but still produce a weak analysis if they don't understand the actual business problem.
What Skills Does a Data Analyst Need?
A successful data analyst usually needs a combination of technical, analytical, and communication skills.
Technical skills
Excel or spreadsheets
SQL
Data visualisation
Statistics
Python or R
Business intelligence tools
Database concepts
Analytical skills
Critical thinking
Problem framing
Pattern recognition
Logical reasoning
Hypothesis testing
Decision-making
Communication skills
Data storytelling
Report writing
Presentation
Explaining complex findings simply
Communicating with stakeholders
Here's the important part: learning tools alone does not make someone a strong data analyst.
You also need to learn how to ask the right questions.
What Is the Data Analytics Project Lifecycle?
A data analytics project generally moves through several stages.
A simplified version looks like this:
Define → Collect → Clean → Analyse → Visualise → Communicate → Act
Stage | What happens? |
Define the problem | Understand the business question |
Collect data | Gather relevant information |
Clean data | Remove errors and inconsistencies |
Analyse data | Identify patterns and relationships |
Visualise results | Present insights through charts and dashboards |
Communicate findings | Explain what the data means |
Take action | Apply the insights to a business decision |
The first step is often the most important.
If the business question is poorly defined, even technically perfect analysis may fail to solve the actual problem.
For a deeper explanation, a dedicated guide on the data analytics project lifecycle can walk through each stage with practical examples.
How Does a Data Analyst Approach a Problem?
Good data analysis starts before opening Excel, SQL, Python, or any analytics platform.
The analyst first needs to understand the problem.
For example, a business might say:
"Our sales are falling."
That is not yet a well-defined analytical problem.
A data analyst might ask:
Which products are experiencing the decline?
When did the decline begin?
Is it happening across all locations?
Has customer traffic changed?
Has the conversion rate changed?
Have prices changed?
Are competitors affecting demand?
These questions turn a vague business concern into something that can actually be investigated.
This approach is often called problem framing.
If you're learning data analytics, developing this way of thinking can be just as important as learning analytical tools.
Data Analytics vs Data Analysis: What's the Difference?
The terms data analytics and data analysis are often used interchangeably, but there is a slight difference.
Data Analytics | Data Analysis |
Broader discipline | A component of data analytics |
Includes collecting, managing, analysing and interpreting data | Mainly focuses on examining data |
Can include predictive and prescriptive approaches | Often focuses on finding patterns and insights |
Connected to broader business decision-making | More focused on answering specific questions |
In simple terms, data analysis is part of the broader data analytics process.
What Tools Are Used in Data Analytics?
Different tools are used depending on the project, organisation, and analyst's responsibilities.
Tool | Common Use |
Microsoft Excel | Data cleaning, calculations and basic analysis |
SQL | Querying databases |
Python | Data analysis, automation and advanced analytics |
R | Statistical analysis |
Power BI | Dashboards and business intelligence |
Tableau | Data visualisation and dashboards |
Google Sheets | Collaborative spreadsheet analysis |
You don't necessarily need to master every tool at once. A beginner can start with spreadsheets and SQL, then gradually learn programming, statistics, visualisation, and other tools based on their career goals.
Is Data Analytics a Good Career?
Data analytics can be a strong career option for people who enjoy working with numbers, solving problems, finding patterns, and turning information into practical conclusions.
The field also applies across multiple industries, which gives analysts opportunities beyond traditional technology companies.
However, getting into data analytics requires more than completing a course or learning a few software tools.
You need to demonstrate that you can:
Understand business problems
Work with real datasets
Clean and analyse data
Build useful reports
Explain insights
Make logical recommendations
Practical projects are therefore an important part of building a data analytics portfolio.
How to Start Learning Data Analytics
If you're a beginner, don't try to learn everything simultaneously.
A simple learning path could look like this:
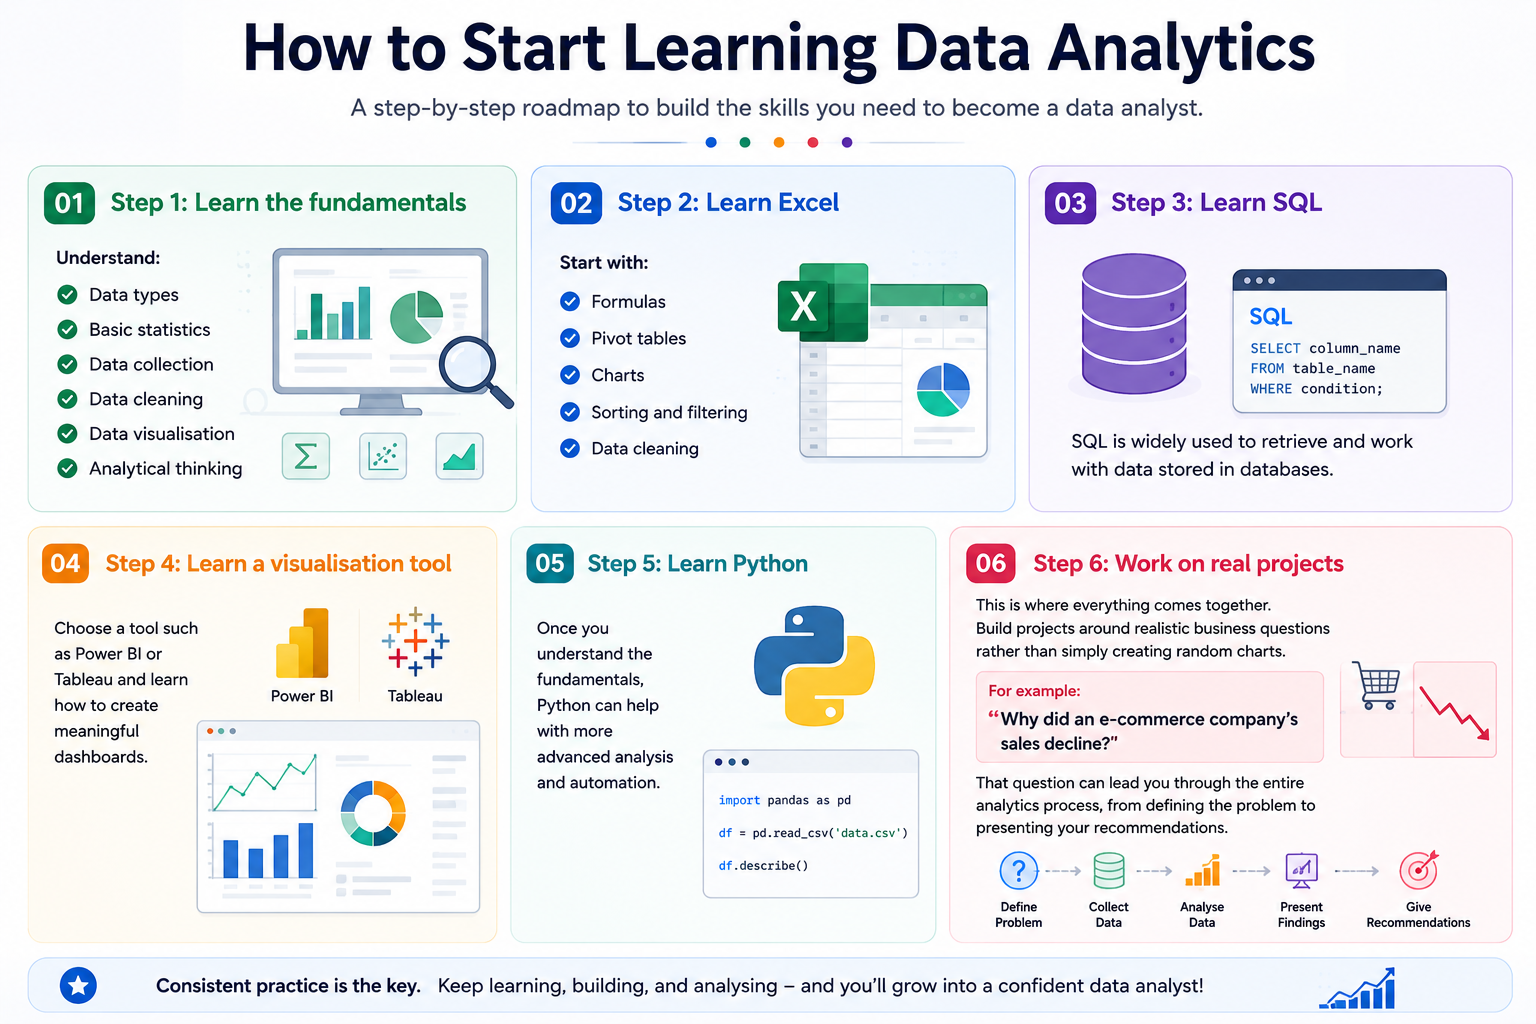
Step 1: Learn the fundamentals
Understand:
Data types
Basic statistics
Data collection
Data cleaning
Data visualisation
Analytical thinking
Step 2: Learn Excel
Start with:
Formulas
Pivot tables
Charts
Sorting and filtering
Data cleaning
Step 3: Learn SQL
SQL is widely used to retrieve and work with data stored in databases.
Step 4: Learn a visualisation tool
Choose a tool such as Power BI or Tableau and learn how to create meaningful dashboards.
Step 5: Learn Python
Once you understand the fundamentals, Python can help with more advanced analysis and automation.
Step 6: Work on real projects
This is where everything comes together. Build projects around realistic business questions rather than simply creating random charts.
For example:
Why did an e-commerce company's sales decline?
That question can lead you through the entire analytics process, from defining the problem to presenting your recommendations.
Final Takeaway
So, what is data analytics? It is the process of turning raw data into useful insights that help businesses understand what is happening, why it is happening, and what they can do next.
For aspiring data analysts, learning data analytics goes beyond understanding concepts or using tools such as Excel, SQL, Python, and Power BI. You also need to learn how to approach real business problems, work with datasets, identify patterns, and communicate your findings clearly.
If you're planning to build a career in this field, the next step is to gain practical experience and develop the skills employers look for. HACA’s Data Analytics Course in Kerala can help you build these skills through structured learning and practical exposure.
Ready to start your journey in data analytics? Explore HACA’s Data Analytics Course today.